
Asset Allocation and Unemployment
- Peter Elston

- Jun 1, 2015
- 3 min read
Updated: May 19, 2022
I am a big believer in keeping tactical asset allocation simple. The more complicated you make it – either by considering too many factors or time frames that are too short – the less effective it tends to be. To support this view I cite work done in 1979 by Richards J. Heuer Jr. involving a study of horse handicappers.
"Inflation pressures are a good leading indicator of monetary policy"
The study found that as one increased the number of pieces of information available to the handicappers from one to five, accuracy of predictions increased. However, beyond five pieces, accuracy decreased. Furthermore, while accuracy levelled off beyond five pieces of information, handicappers’ confidence in their predictions continued to increase!
My approach to tactical asset allocation focuses, simply, on the business cycle and how different asset classes perform at certain times. This means having a longer term time horizon, because business cycles average around six years.
To gauge the business cycle I use one indicator: the unemployment rate. There is nothing more fundamental to an economy than the percentage of the workforce that it is not, for whatever reason, able to be put to work. Employment is closely linked with economic activity, a major determinant of bond and equity markets, hence my use of it in tactical asset allocation. This of course makes complete sense. Why? Because the unemployment rate is a good measure of inflation pressures and inflation pressures are a good leading indicator of monetary policy, the key driver of financial asset prices.
Of course if one is using the unemployment rate to predict the future path of asset prices, one must first establish that the unemployment rate is itself predictable. A simple way to do this is to determine if there is a sufficiently high correlation between the change in the unemployment rate over one period and the change over the next period. If there were no correlation, this would indicate that the unemployment rate follows a random walk and is thus unpredictable.
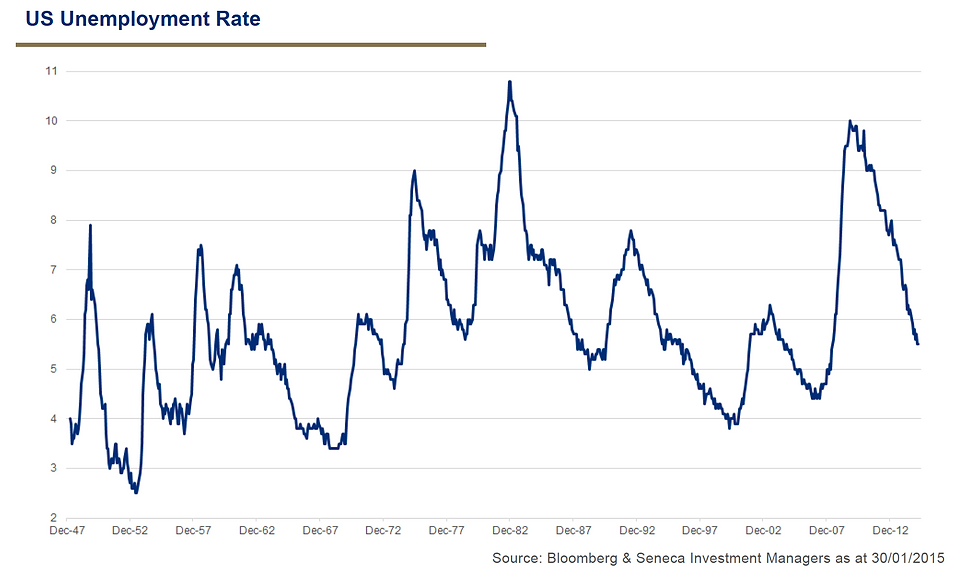
It turns out that, at least in the case of the US, changes over four months have the greatest predictive ability (three and five months changes are less correlated than four months). The correlation coefficient between four month changes and subsequent four month changes is 0.54, which indicates a fairly high degree of correlation. If I’ve lost you, just look at the chart below showing the unemployment rate in the US over the last 70 years and ask yourself whether it looks random or whether it contains some sort of pattern.
The relationship between the unemployment rate and long-term interest rates is a simple one: inflation. If the unemployment rate is above a certain level, inflation pressures will be low or falling and thus bond prices rising. Similarly, if the labour market is tight, inflation pressures will tend to be high or rising, a not-so-good environment for bonds. Equities tend to perform poorly when unemployment is rising, as rising unemployment is a feature of recessions and thus weak corporate profits.
Thus, much of the time, equity and bond markets will be out of sync with each other (negatively correlated). Safe haven bond markets like rising unemployment. Equities do not.
So, what are unemployment rates around the world at the moment saying about the outlook for bonds and equities?
In the case of developed markets, unemployment has fallen pretty much everywhere, the reason for the good performance of equities generally. However, rates remain above levels that would be considered inflationary, so bonds have also been performing well. Looking ahead, the US and the UK are closer to the point at which inflation will start to rise than is the case in Europe and Japan, where unemployment rates remain closer to their peaks than their troughs. So, although equity markets in all four still look well supported, they look best supported in Europe and Japan.

As for bonds, there appears to be very little value in developed sovereign markets, but since inflation pressures are likely to remain most subdued in Europe and Japan, their bonds would be the relatively more attractive, if unappealing in absolute terms.
Of course there will always be noise that causes short-term volatility, but one would be advised to ignore this and look for the pattern. Simple.
Published in Investment Letter, June 2015
The views expressed in this communication are those of Peter Elston at the time of writing and are subject to change without notice. They do not constitute investment advice and whilst all reasonable efforts have been used to ensure the accuracy of the information contained in this communication, the reliability, completeness or accuracy of the content cannot be guaranteed. This communication provides information for professional use only and should not be relied upon by retail investors as the sole basis for investment.


Comments